
Correlation
In this unit:
- Understand correlation.
- Different types of correlation.
- Procedure for undertaking correlation analysis and interpreting the results.
R and RStudio Data Activities
Using the Health_Data, please perform the following functions in R:
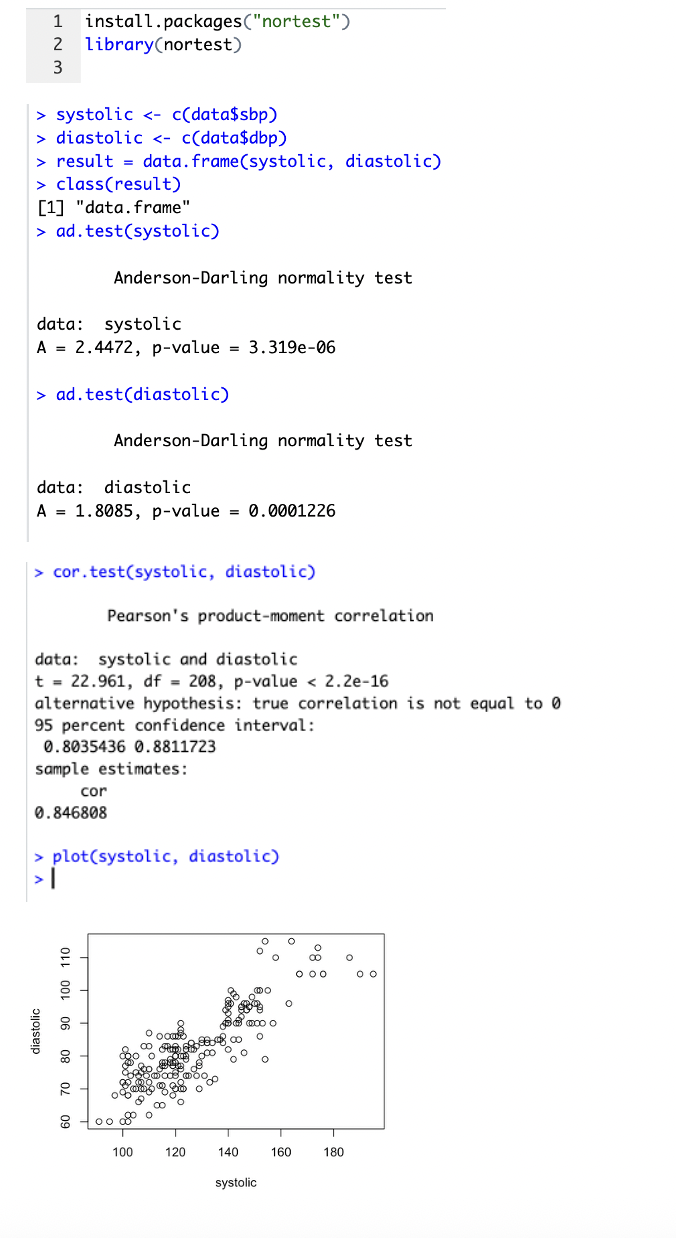
- Find out correlation between systolic and diastolic BP.
- Produce a scatter plot between systolic and diastolic BP.
H0: No linear relationship exists; H1: Some linear relationship exists.
Results in image on left. High r of 0.846808 indicates strong positive linear correlation. Low p-value (< 2.2e-16) indicates strong evidence to reject H0.
r value of 0.846808 is within the 95% CI range (0.8035436 to 0.8811723).