
Producing Plots and Introducing Calculus
In this unit:
- Discuss the different types of graphs and plots.
- Explore the basic plot functions in R (and Python).
- Illustrate adjusting the axes of a plot.
- Explain the changing colour and size of a plot.
- Introduce calculus – differentiation and integration.
R and RStudio Data Activities
Using the Crime Survey for England and Wales, 2013-2014: Unrestricted Access Teaching Dataset (see Unit 1), perform the following activities:
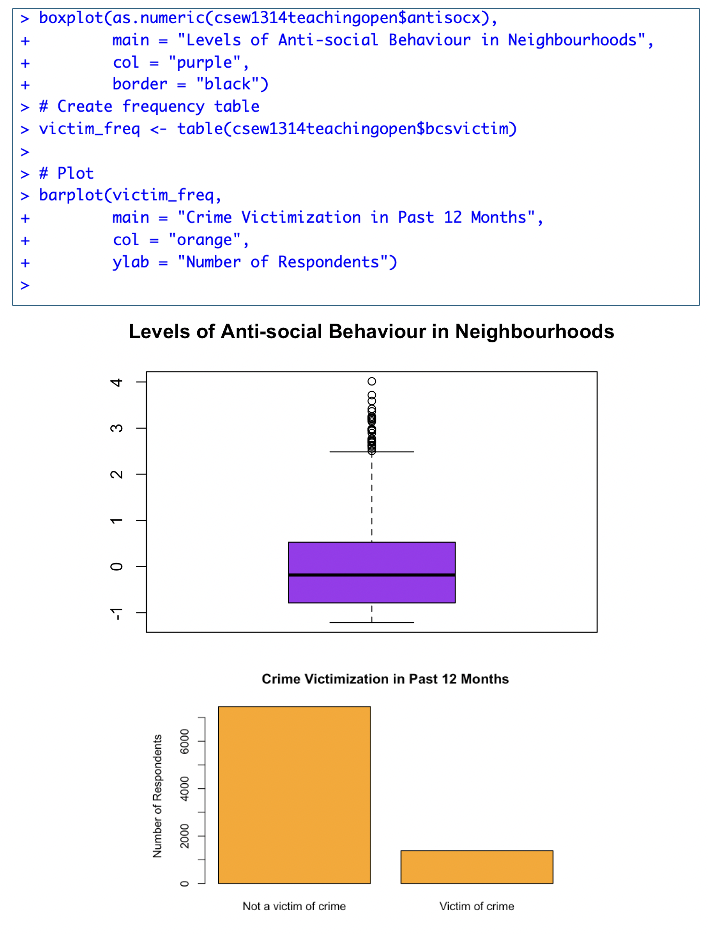
- Create a boxplot for the variable 'antisocx'
- Create a boxplot for assessing levels of anti-social behaviour that the survey respondents experience in their neighbourhood (use the variable: antisocx).
- Create a bar plot using either the barplot() function or the ggplot() function to assess whether or not the survey respondents experienced crime in the 12 months prior to the survey (use the variable 'bcsvictim'). Give the graph a suitable title and choose a colour for the bars (e.g., orange).