
Parametric Tests
In this unit:
- Explore different types of parametric tests and their characteristics.
- Understand normality testing before performing parametric tests.
- Performing t-tests and F-tests using R functions.
- Understand how to interpret the results of t-tests and F-tests.
R and RStudio Data Activities
Using the Health_Data, please perform the following functions in R:
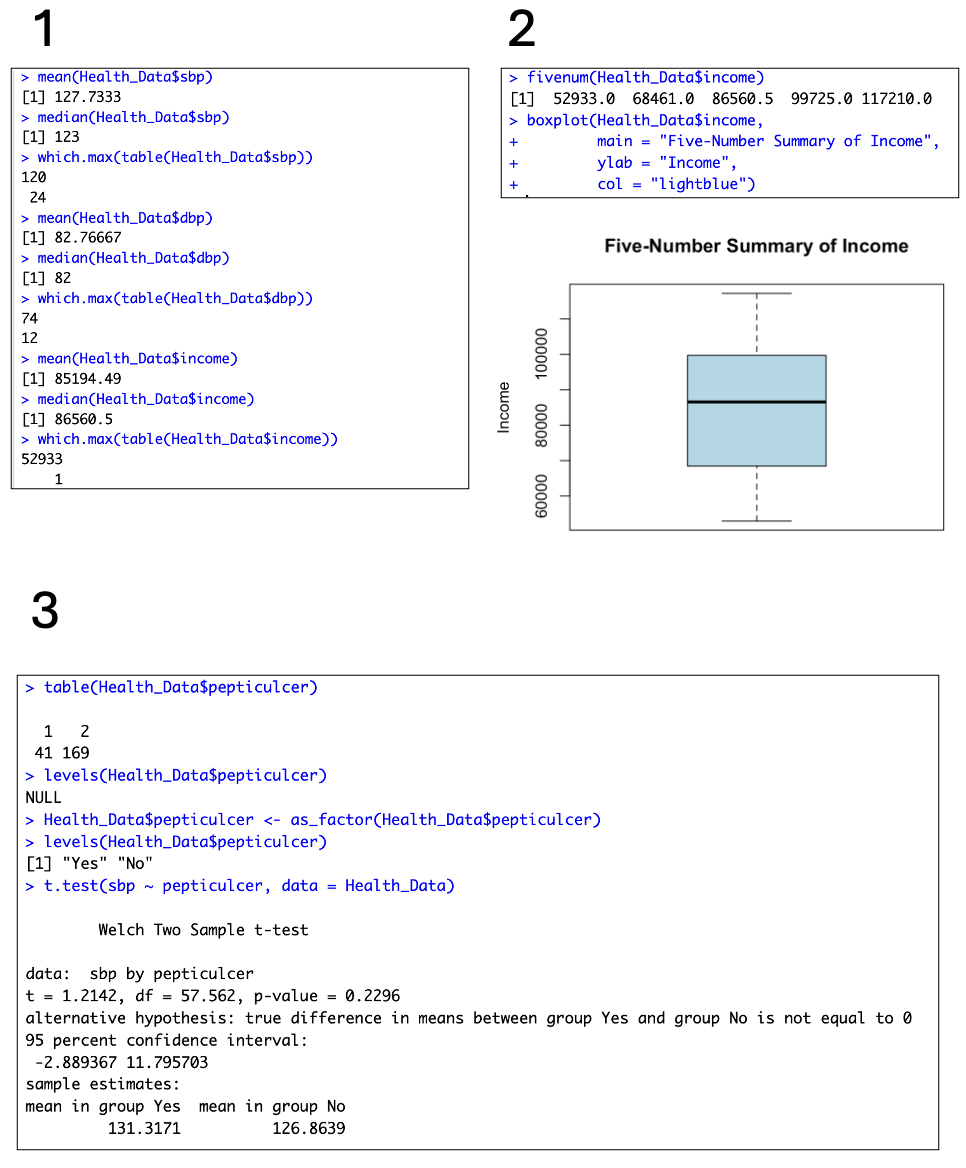
1) Find out mean, median and mode of variables sbp, dbp and income.
-> Mean and median are embedded commands. Mode requires a different approach because that pulls information about how the data is stored.
2) Find out the five-figure summary of income variable and present it using a Boxplot.
-> Displayed in image
3) Run a suitable hypothesis test to see if there is any association between systolic blood pressure and presence and absence of peptic ulcer.
-> Displayed in image. The pepticulcer data element is stored as '1' or '2', so it is converted with the 'as.factor' command. The t-test results return a p-value > 0.05, which means we failed to reject H0.