Nonparametric Tests
In this unit:
- Explore different types of nonparametric tests and their characteristics.
- Performing nonparametric tests using R functions.
- Understand how to interpret the results of nonparametric tests.
R and RStudio Data Activities
Using the Health_Data, please perform the following functions in R:
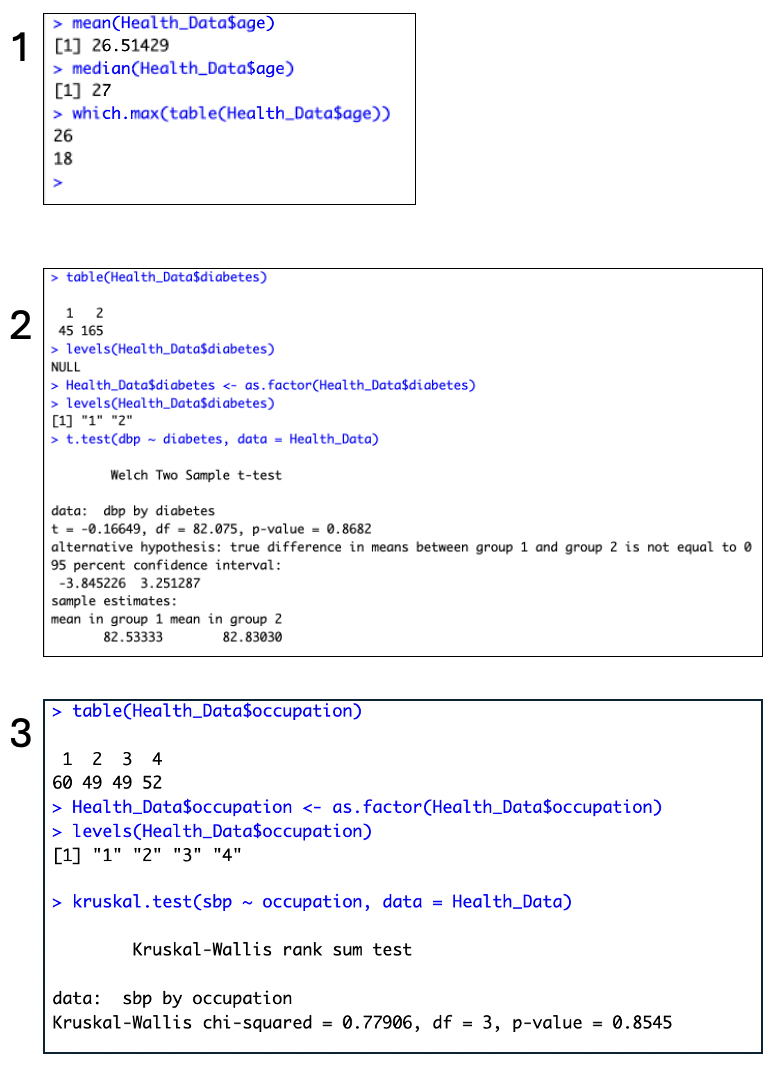
1) Find out the mean, median and mode of ‘age’ variable.
-> Displayed in image.
2) Find out whether median diastolic blood pressure is same among diabetic and non-diabetic participants.
-> T-test output displayed in image. P-value>0.05, so we failed to reject H0.
3) Find out whether systolic BP is different across occupational group.
-> Kruskal-Wallis output displayed in image. P-value>0.05, so we failed to reject H0.