
Regression Analysis
In this unit:
- Explain the concept of Regression.
- Interpret model fit, statistical significance, and coefficient interpretation.
- Create scatter plots for model building.
- Illustrate generalised linear regression model in R.
R and RStudio Data Activities
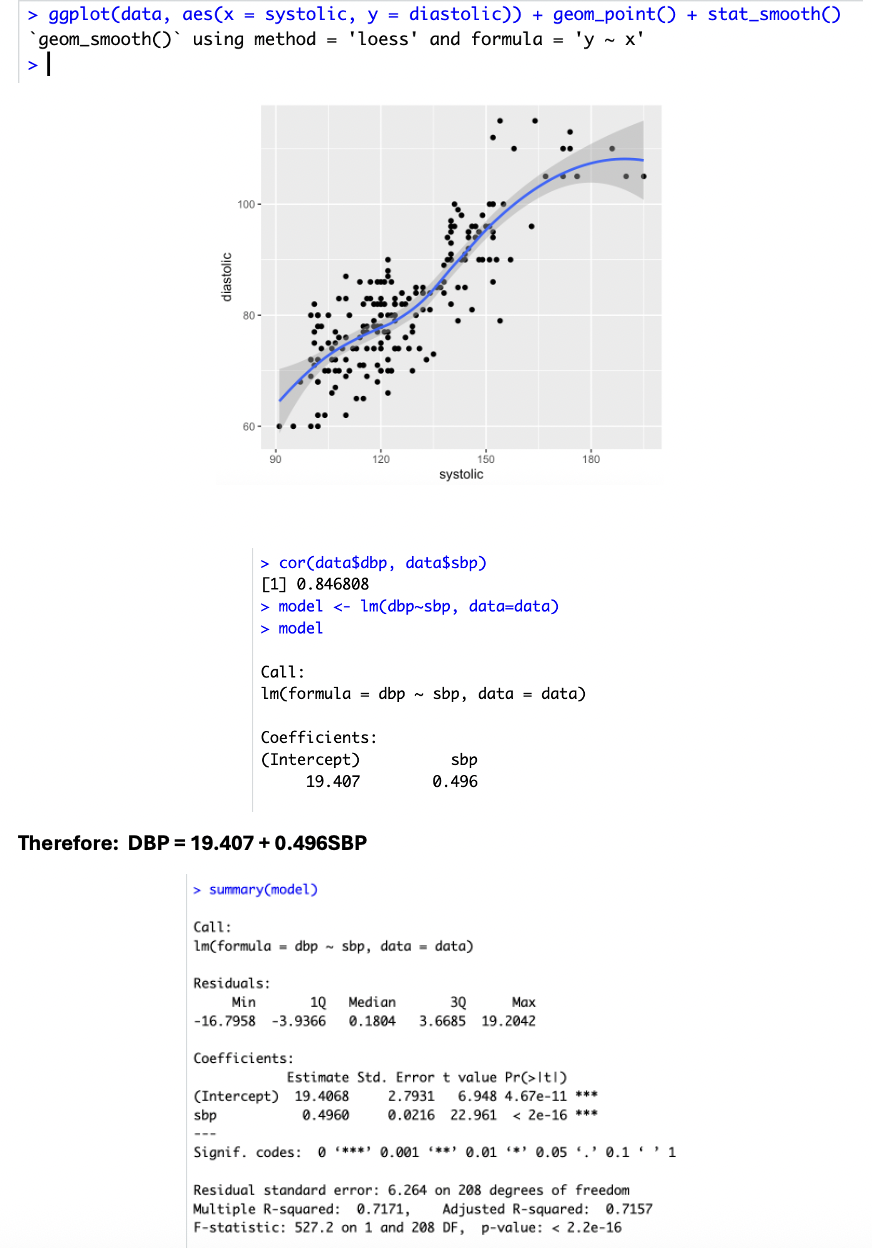
Using the Health_Data, please perform the following functions in R:
- Perform simple linear regression analysis to find the population regression equation to predict the diastolic BP by systolic BP.
- Interpret the findings of regression analysis at 5% level of significance.
H0: No linear relationship exists; H1: Some linear relationship exists. Results in image on left.
Linear regression formula: DBP = 19.407 + 0.496SBP. Very small p-values for the intercept and predictor variable indicate they are highly significant, so we reject H0 and accept H1.